Web Story analytics


Understanding how your audience interacts and engages with your Web Stories helps you create even better ones. This guide outlines metrics, terminology and visualizations that grant you greater insight to your Web Story analytics.
Set up Web Story analytics
While many analytics providers support the Web Story format, Google Analytics comes with the essential event tracking capabilities out-of-the-box. Include Google Analytics in your Web Stories by supplying your Google Analytics ID to your Web Story visual editor. The WordPress Web Story editor provides a field for you to enter it under settings.
If you don’t have a Google Analytics account, you can create one for free. For help getting started with Google Analytics, checkout Google’s Analytics Academy, a resource with free online courses.
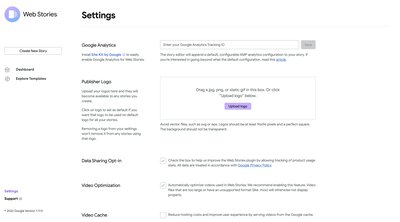
Navigate to the Web Stories for WordPress settings to include your Google Analytics ID.
Web Story user journey
A user journey is the experience a user has when interacting with your content. In a Web Story, this journey consists of three phases: Discovery, Consumption and Post-Click. Understanding metrics from each of these phases helps identify where your audience is most engaged, and areas that could be improved.
Discovery
Discovery is all about the outlets on which your Stories might appear or surface. These outlets might be Google Discover, search results or distribution through your own website. Important metrics in the discovery phase include:
- Impressions: Impressions are the number of times your Web Story appeared to a user.
- Clicks: Clicks are how many times a user clicked, or tapped, to open your Web Story.
- Click Through Rate or CTR: CTR is the percentage of impressions that resulted in a click.
These metrics give insights to if potential readers are seeing your story and how many are engaging with it. If you have a low number of impressions, this means your story isn't surfacing to users. Check if you've forgotten to add something to your metadata, or investigate SEO improvements. However, if you have high impressions and low CTR, your Web Story is surfacing, but user’s aren’t engaging. This could be for a number of reasons; maybe the Web Story poster image isn’t loading correctly, or your title isn’t catchy enough.
Consumption
The consumption phase begins when a user clicks into your Web Story, and ends when they exit or finish the Web Story. Important metrics in the consumption phase include:
- Story Start: The number of times a user clicked on your Web Story AND reached at least the first page.
- Story completion: The number of users that reached the last page of your Web Story.
- Average view time: The average time a user spent viewing your Web Story.
- Views by page: The number of views on each of your Web Story pages.
- Average depth or on average: The average page number user’s tapped into your Web Story.
Post-Click
A user reaches the post-click phase when they finish your Web Story and click into a different experience. This could be a different Web Story, to your website, or a social media link. The only metric in this phase is Post-Click.
Traffic from Web Stories
You can track what traffic comes from Web Stories, such as referral or affiliate links, the same as you would regular webpage traffic. This is because Web Stories are regular web pages with their own URL. Check your referral analytics for your Web Story URLs.